June 12, 2024
Today is a big day for macro data! As already written in the weekly outlook a bit, we have US CPI hitting at 8:30 am EST.
Here, we look a bit into more detail about what is expected and what hints we can take away from other data + possible trading plays.
CPI: What’s expected:
There is a consensus for a 0.1% increase MoM on the headline, and 0.3% on the core. For the YoY readings, we have a forecast of 3.4% on the headline and 3.5% on the core index.
Other May data:
ISM PMIs:
We already got ISM PMIs for May, and they have a sub-index called “prices paid,” which translates to inflation in some regard. So looking at those data points could give us a hint if price pressures are easing for May or if they actually accelerated.
Services: ISM services prices paid for May: 58.1 vs 59.2 in April
We can see a slight slowdown in the numbers, but they remain well above the 50 line, which is considered the “neutral” line, indicating that price pressures are still present. This suggests a possible hint for a strong CPI reading.
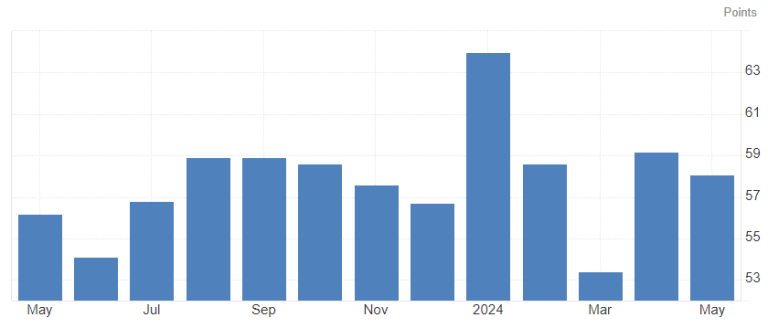
ISM services prices paid
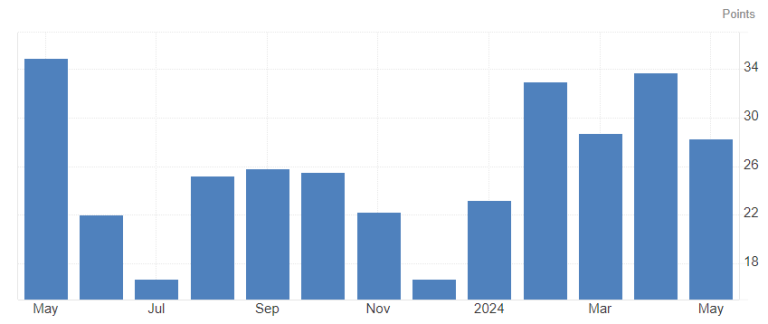
Manufacturing: ISM manufacturing prices for May: 57.0 vs 60.9 in April
There is a slowdown in prices in May compared to last month, but the value is still well above 50, which means prices are still rising and not falling – a hint for a strong CPI reading still.
ISM manufacturing prices
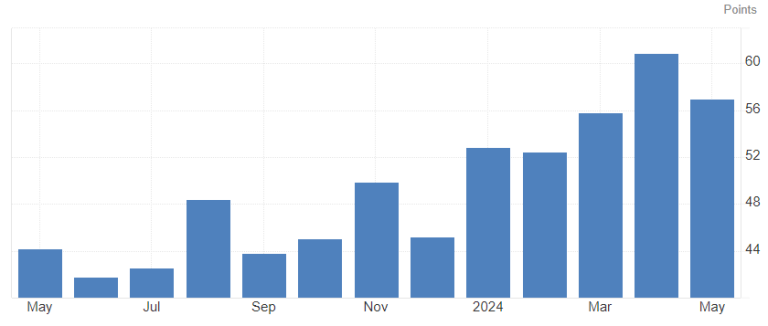
NY Empire State: Same as with the ISM PMI report, we get a sub-index on the NY Empire State report that is price related: 28.3 for May vs 33.7 in April
A slowdown in that data point is a possible hint of a soft CPI reading.
NY Empire State prices paid
Philadelphia Fed Manufacturing Index: And same again, another sub-index which is price related on yet another PMI data point: 18.7 for May vs 23.0 for April
Another slowing data point which could be another hint of a soft CPI reading.
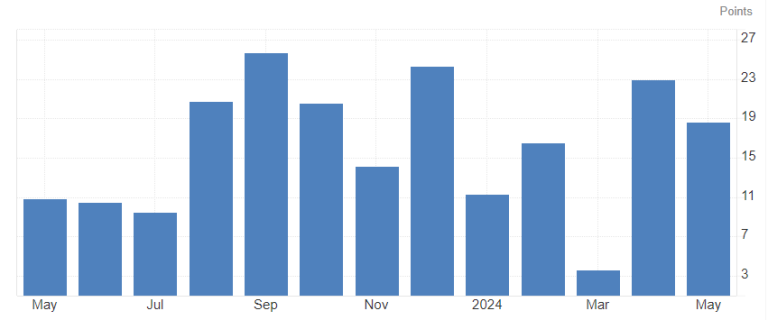
Philly FED prices paid
Energy:
An essential aspect providing solid hints for the headline numbers is the energy component, which contributes significantly to the CPI reading.
Let’s delve into what oil and natural gas did in May
Crude Oil:
Crude oil experienced a decline of $4.95 or 6.05% during the month of May. This suggests a strong indication of a potential miss on the energy component of the headline CPI.
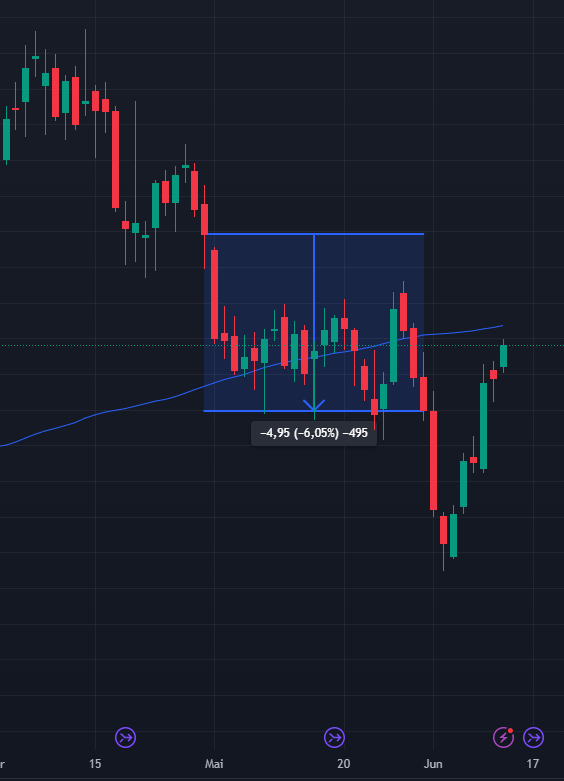
Crude Oil futures
Natural Gas:
Natural gas, on the other hand, saw an increase of $0.659 or 33.18% in May, marking a significant surge. While natural gas has a smaller impact on the energy portion of the CPI compared to oil, this substantial price hike should not be disregarded.
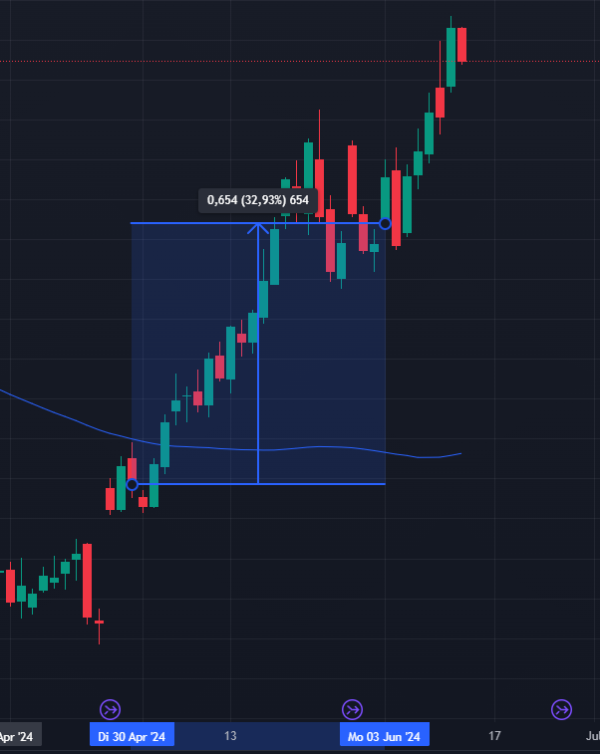
Natgas futures
All in all I would say this still speaks for a weaker energy part of the headline in CPI, but likely not a lot.
Housing:
We won’t have US housing data for May until June 20, so we can’t make any significant analysis based on those data points for today’s CPI reading. However, I’ve gathered information from various sources in the sector throughout the US, indicating that the real estate (RE) field is experiencing a significant downturn across all fronts. Prices for new and listed homes are declining, and rents are also seeing a slight decrease.
This should offer some relief in the housing component of the CPI reading, which is considered a “sticky” part and is also included in the core index.
Price Levels:
Looking at some charts, we can see mixed performance so far on the USD across the board:
- EURUSD and GBPUSD are both up 20 pips on the day.
- AUDUSD and NZDUSD are basically flat on the day.
- USDJPY is up 20 pips.
- USDCHF is down 20 pips.
- USDCAD is down a mere 10 pips.
Not a lot of movement all around, really.
Bonds are basically flat on the day as well.
Equities are holding up nicely so far but are more or less flat as well.
Gold is down $1.
BTC is up 0.8% so far.
Focusing on FX and the USD, DXY is currently trading right at a decision level/breakout-retest level at roughly 105.1.
On a hot CPI reading, I can see it trading up to the next bigger resistance level in an instant to 105.7, then the flat level at 106, and the yearly highs at 106.5 as an extension.
On a weak CPI reading, I can see it falling to the next support level, which was a breakout level on last week’s NFP at 104.5, and further to the recent lows at 104 flat.
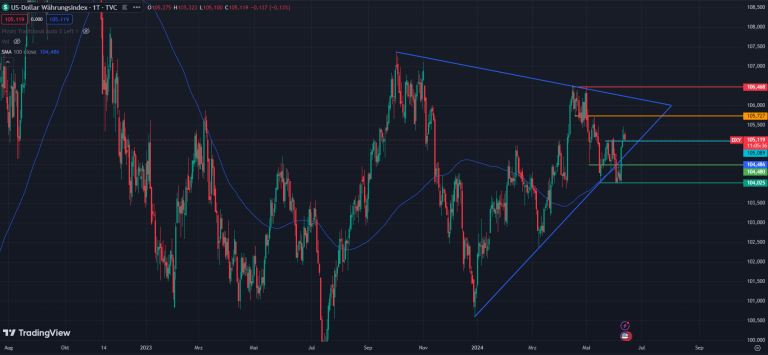
DXY daily chart
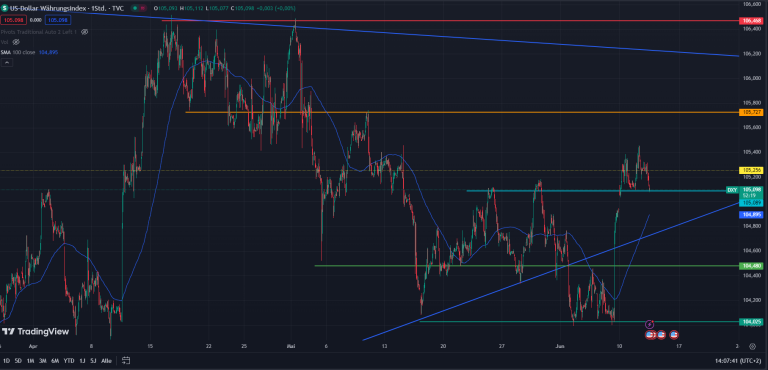
DXY 1h chart
Don’t forget we have FOMC today as well, though, so we might not extend any movements too much just yet!
Looking at the data present, I think the CPI reading will be weak, honestly. Why? We saw still-strong price data in the PMIs, but I think the slowdown in energy and the housing market will be enough to give us a soft reading, especially on the core, which in turn would lead to some dovish price movement: bonds up (yields down), USD down, equities up, commodities up.
I do think the bond move will be the biggest one and the only one that lasts into the FOMC later today. USD should have some struggles as well, but should not fall too much.
Whatever CPI brings today, be sure you have your risk limits set!
Cheers and have a highly profitable trading day!
Dom
.png)
.png)
.png)